Latest Support and Resistance Levels for Nifty 50 – Stock Market Trading Guide
Support and resistance levels play a crucial role in stock market trading, helping traders make informed decisions and predict price movements. These levels act as psychological barriers, influencing buying and selling behaviors. In this comprehensive guide, we will explore the latest support and resistance levels, their significance, and how traders can leverage them for profitable trading.
What Are Support and Resistance Levels?
Support and resistance are fundamental concepts in technical analysis that determine price action in the stock market.
- Support Level: This is the price level where buying interest is strong enough to prevent the price from declining further. It acts as a floor, preventing excessive downward movement.
- Resistance Level: This is the price level where selling interest is strong enough to prevent the price from rising further. It acts as a ceiling, limiting excessive upward movement.
These levels are identified using historical price data, moving averages, Fibonacci retracements, and other technical indicators.
Why Are Support and Resistance Important?
1. Identifying Entry and Exit Points
Traders use these levels to determine the best time to enter or exit a trade. Buying near support and selling near resistance increases the chances of a successful trade.
2. Risk Management
Placing stop-loss orders near support and resistance levels helps traders minimize risks. A well-placed stop-loss protects capital and prevents excessive losses.
3. Confirmation of Trend Reversals
A breakout above resistance or a breakdown below support signals a potential trend reversal. This helps traders adjust their strategies accordingly.
4. Enhancing Trading Strategies
Traders incorporate support and resistance into various strategies such as breakout trading, trend following, and range trading.
Types of Support and Resistance Levels
1. Static Support and Resistance
These levels remain constant over time and are identified based on historical price action. Examples include previous highs and lows, round numbers, and psychological levels.
2. Dynamic Support and Resistance
These levels change over time and are based on moving averages, trendlines, and Fibonacci levels. They provide more flexibility in technical analysis.
3. Major vs. Minor Support and Resistance
- Major Levels: These are significant price levels that have repeatedly acted as strong barriers.
- Minor Levels: These are less significant levels that provide temporary support or resistance.
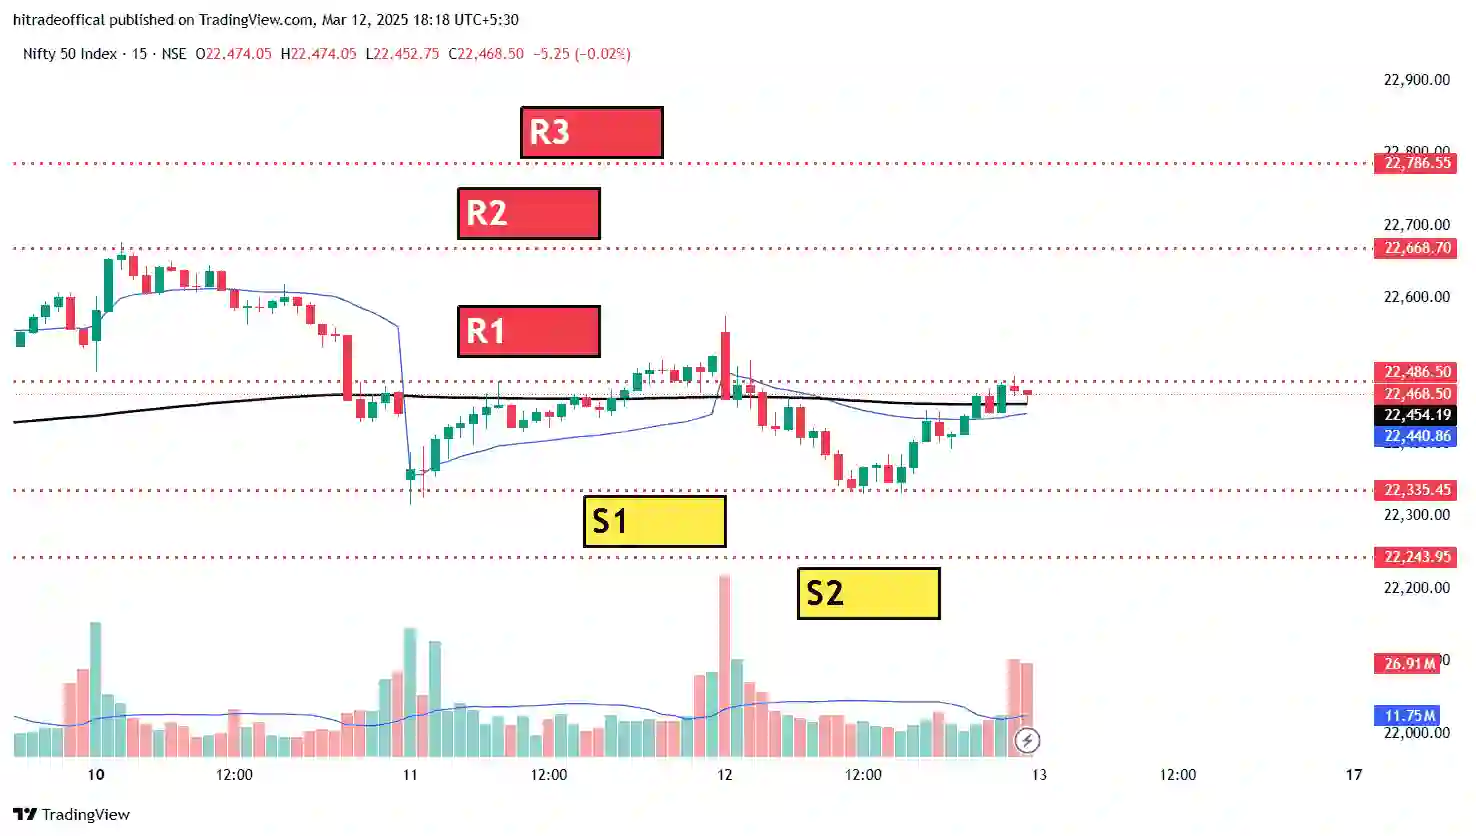
Latest Support and Resistance Levels in Nifty 50
The Nifty 50 Index, a benchmark index for the Indian stock market, is widely followed by traders. Based on recent price action, the latest key levels are:
Resistance Levels:
- R1 (22,486.50): A critical resistance level where selling pressure may increase.
- R2 (22,668.70): If Nifty crosses R1, this level could act as another barrier.
- R3 (22,786.55): The highest resistance level, indicating a strong bullish breakout if crossed.
Support Levels:
- S1 (22,335.45): A crucial support level where buyers may step in.
- S2 (22,243.95): A breakdown below S1 could push Nifty to this level.
How to Trade Using Support and Resistance?
1. Buying at Support
When the price reaches a support level and shows signs of reversal, traders enter a long position, anticipating an upward movement.
2. Selling at Resistance
When the price approaches resistance and starts declining, traders enter a short position, expecting a downward movement.
3. Breakout Trading
- Bullish Breakout: If the price breaks above resistance with strong volume, it signals an uptrend.
- Bearish Breakdown: If the price breaks below support, it indicates a potential downtrend.
4. Using Stop-Loss Orders
Traders should place stop-loss orders slightly below support for long trades and slightly above resistance for short trades.
Technical Indicators for Support and Resistance Trading
1. Moving Averages
Simple Moving Averages (SMA) and Exponential Moving Averages (EMA) act as dynamic support and resistance levels.
2. Volume Analysis
A breakout with high volume confirms the strength of the movement.
3. Relative Strength Index (RSI)
RSI indicates overbought or oversold conditions, helping traders make better decisions.
4. Bollinger Bands
These bands measure volatility and help identify potential reversals near support and resistance.
Common Mistakes Traders Make
1. Ignoring Market Context
Traders should consider overall market conditions, news, and economic events that influence price action.
2. Not Using Stop-Loss Orders
Failure to set stop-loss levels can lead to significant losses.
3. Misidentifying Levels
Incorrectly marking support and resistance can lead to poor trade execution.
Real-World Applications of Support and Resistance
Professional traders and institutions use these levels for:
- Algorithmic trading
- Swing trading strategies
- Hedging positions
Conclusion
Support and resistance levels are essential tools for traders in the stock market. Understanding how to use them effectively can lead to better trading decisions and higher profits.
For the latest updates on trading strategies, stock market insights, and financial education, visit Stock Bharti.
Disclaimer: This article is for educational purposes only and should not be considered financial advice. Always conduct thorough research before making any trading decisions.