Introduction
Stock market trading is a game of probabilities, where patterns, support, and resistance levels play a crucial role in decision-making. Understanding these technical concepts helps traders identify potential buying and selling opportunities. In this article, we will cover the fundamental aspects of support and resistance, chart patterns, and the ascending triangle. Additionally, we will analyze stock charts of MARICO, BEML, MAZDOCK, MRPL, and RAIN using these technical indicators.
What is Support and Resistance?
Support and resistance are fundamental concepts in technical analysis that help traders understand price movement in the stock market.
- Support Level: This is a price level where a stock tends to stop falling due to increased buying interest. It acts as a “floor,” preventing further decline.
- Resistance Level: This is a price level where a stock tends to stop rising due to increased selling interest. It acts as a “ceiling,” preventing further upward movement.
These levels are crucial for traders to determine entry and exit points in a trade. When a stock price breaks above resistance, it signals potential bullish momentum, while a breakdown below support suggests bearish sentiment.
Example: Support and Resistance in MARICO Stock Chart

What is the Bullish Engulfing Pattern in Trading?
A Bullish Engulfing Pattern is a candlestick pattern that signals a potential reversal from a downtrend to an uptrend. It consists of two candles:
- First Candle (Bearish): A small red (bearish) candle that shows continued selling pressure.
- Second Candle (Bullish): A large green (bullish) candle that completely engulfs the body of the previous red candle, indicating strong buying interest.
What Does the Bullish Engulfing Pattern Indicate?
- It suggests that buyers are taking control after a period of selling.
- It often appears at the end of a downtrend, signaling a potential trend reversal.
- The stronger the second candle (higher volume and bigger size), the more reliable the pattern.
How to Trade a Bullish Engulfing Pattern?
- Entry: Traders often enter a long (buy) position after the pattern is confirmed, preferably on the next candle.
- Stop-Loss: Placed below the low of the engulfing candle to manage risk.
- Take Profit: Set at the next resistance level or based on risk-reward strategy.
Example of Bullish Engulfing Pattern in a Stock Chart
If a stock has been in a downtrend and then forms a bullish engulfing candle, it may indicate the start of a new uptrend. Traders may look for confirmation from high trading volume, support levels, or technical indicators like RSI and MACD before entering a trade.
What is a Chart Pattern?
A chart pattern is a recognizable formation in stock price movements that indicates a potential future price movement. Traders use these patterns to make informed decisions about buying and selling stocks. There are two main types of chart patterns:
- Continuation Patterns: Indicate that the current trend will likely continue. Examples include ascending triangles and flags.
- Reversal Patterns: Indicate a change in trend direction. Examples include head and shoulders and double tops.
Example: Chart Pattern in BEML Stock Chart

Understanding the Ascending Triangle Pattern
The ascending triangle is a bullish continuation pattern that signals a potential upward breakout. It consists of:
- A horizontal resistance level, where the stock price repeatedly fails to break through.
- A rising trendline, which forms as buyers step in at higher prices, creating higher lows.
- A breakout point, where the price moves above the resistance level, confirming a bullish trend.
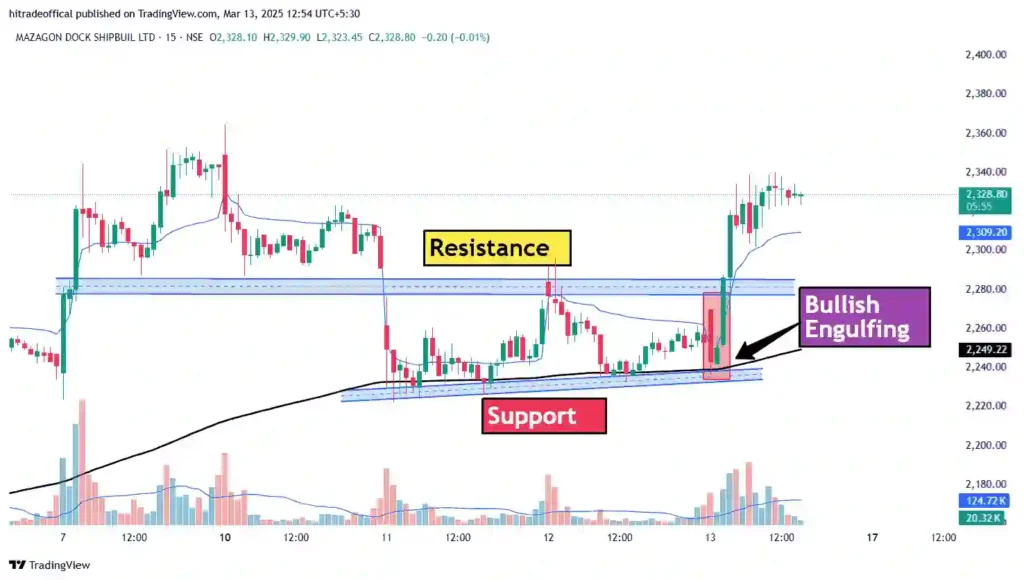
Example: Ascending Triangle in MAZDOCK Stock Chart
Stock Analysis Using Patterns
Now, let’s analyze the stocks of MARICO, BEML, MAZDOCK, MRPL, and RAIN using support, resistance, and the ascending triangle pattern.
MARICO Stock Analysis
- Identified strong support and resistance levels.
- Chart pattern indicates a possible breakout above resistance.

BEML Stock Analysis
- Price action suggests an upward trend within a continuation pattern.
- Potential bullish breakout on high volume.

MAZDOCK Stock Analysis
- Clear ascending triangle pattern visible on the chart.
- Breakout could lead to higher price targets.

MRPL Stock Analysis
- Support levels are holding strong, indicating potential reversal.
- If resistance is broken, an uptrend might begin.

RAIN Stock Analysis
- Resistance level acting as a major hurdle for price movement.
- A breakout could trigger a strong upward move.

Conclusion
Understanding support, resistance, and chart patterns like the ascending triangle can help traders make more informed decisions. By applying these concepts to stock analysis, one can better predict potential price movements. Always combine technical analysis with risk management strategies to maximize success in trading.
Key Takeaways:
✔ Support and resistance levels help define entry and exit points.
✔ Chart patterns provide insights into potential price movements.
✔ The ascending triangle is a powerful bullish continuation pattern.
✔ MARICO, BEML, MAZDOCK, MRPL, and RAIN show various technical setups based on support, resistance, and patterns.
Stay informed, trade wisely, and leverage technical analysis for better decision-making in the stock market!
(Disclaimer: This article is for informational purposes only and does not constitute financial advice. Always conduct your own research before making investment decisions.)
Frequently Asked Questions (FAQs)
1. What is support in technical analysis?
Support is a price level where a stock tends to find buying interest, preventing it from falling further. It acts as a floor where demand is strong enough to halt a price decline.
2. What is resistance in stock trading?
Resistance is a price level where selling pressure outweighs buying, preventing the stock from rising further. It acts as a ceiling where upward movement slows down or reverses.
3. How can traders use support and resistance levels?
Traders use support and resistance to identify potential entry and exit points. Buying near support and selling near resistance is a common strategy. Breakouts above resistance or below support signal potential trend changes.
4. What are stock chart patterns?
Chart patterns are formations created by stock price movements over time. They help traders predict future price actions based on past trends.
5. What is an ascending triangle pattern?
An ascending triangle is a bullish continuation pattern where the stock price forms higher lows while facing resistance at the same level. A breakout above resistance usually signals further upward movement.
6. How can I identify an ascending triangle pattern?
Look for a horizontal resistance level and a rising trendline that creates higher lows. The pattern is confirmed when the stock breaks above the resistance level with strong volume.
7. What does a breakout indicate in trading?
A breakout occurs when the stock price moves beyond a defined support or resistance level, indicating a potential start of a new trend. Breakouts are often accompanied by increased volume.
8. Why is volume important in chart patterns?
Volume confirms the strength of a price movement. High volume during a breakout suggests strong buying or selling interest, making the move more reliable.
9. How do support and resistance levels help with stop-loss placement?
Traders place stop-loss orders slightly below support (for long trades) or above resistance (for short trades) to limit potential losses in case the price moves against them.
10. What is the significance of MAZDOCK’s stock chart pattern?
The MAZDOCK stock chart shows key support and resistance levels, along with potential breakouts. Analyzing its pattern can help traders make informed trading decisions.
11. How do MARICO’s stock patterns indicate future movements?
MARICO’s chart analysis helps identify potential bullish or bearish trends based on past price behavior and support-resistance interactions.
12. What trading strategy should I use for MRPL based on its chart pattern?
If MRPL is forming an ascending triangle, traders might look for a breakout above resistance with high volume to enter long positions.
13. How can BEML’s support level be used for trading?
If BEML approaches a strong support level, traders might consider buying opportunities, anticipating a price bounce.
14. What does the RAIN stock chart suggest about future price movements?
Analyzing the RAIN stock chart helps traders identify key support, resistance, and breakout points, guiding their trading decisions.
15. Why should traders use multiple indicators along with chart patterns?
Combining chart patterns with indicators like RSI, MACD, and moving averages improves accuracy in predicting stock movements.