Introduction
The Bullish Engulfing Candlestick Pattern is a powerful reversal signal used by traders in stocks, forex, and crypto markets. It occurs when a strong bullish candle completely engulfs the previous bearish candle, indicating a shift in market sentiment. When combined with key support levels, volume confirmation, and indicators like RSI and MACD, this pattern helps traders identify high-probability trade setups. In this article, we explore real-world examples of how traders profit using the Bullish Engulfing pattern across different markets.
1. What is a Bullish Engulfing Candlestick Pattern?
A Bullish Engulfing Candlestick Pattern is a powerful reversal signal in technical analysis that indicates a potential shift from a downtrend to an uptrend. It is widely used by traders to identify buying opportunities in stocks, forex, and commodities.
🔍 How Does It Form?
A Bullish Engulfing pattern consists of two candlesticks:
✅ First Candle – A small red (bearish) candle, indicating continued selling pressure.
✅ Second Candle – A large green (bullish) candle that completely engulfs the first one, showing strong buying momentum.
This pattern signals that buyers have taken control, pushing prices higher and potentially leading to a trend reversal.
📈 Significance of Bullish Engulfing in Trading
- 🔵 Indicates Strong Buying Pressure – A clear sign of market confidence.
- 🔵 Best Used with Volume Confirmation – Higher volume on the second candle makes the pattern more reliable.
- 🔵 Works Well with Support Levels – When formed near a support zone, the chances of reversal increase.
👉 Read more about Bullish Engulfing and its impact on stock trends at Stock Bharti.
For a deeper understanding of candlestick patterns, check out Investopedia’s Guide on Candlestick Patterns.
🛠 How to Use This Pattern in Your Trading Strategy?
1️⃣ Identify a Downtrend – The market should be in a bearish phase before the pattern forms.
2️⃣ Look for the Engulfing Formation – The green candle must fully engulf the previous red candle.
3️⃣ Confirm with Volume and Indicators – Use tools like RSI, Moving Averages, and MACD for confirmation.
4️⃣ Set Entry, Stop Loss, and Target – Place entry above the high of the engulfing candle and stop loss below its low.
📌 Learn how to trade effectively with Bullish Engulfing using real examples on HiTrade Official.
Would you like me to write about how to trade this pattern with real examples? 🚀
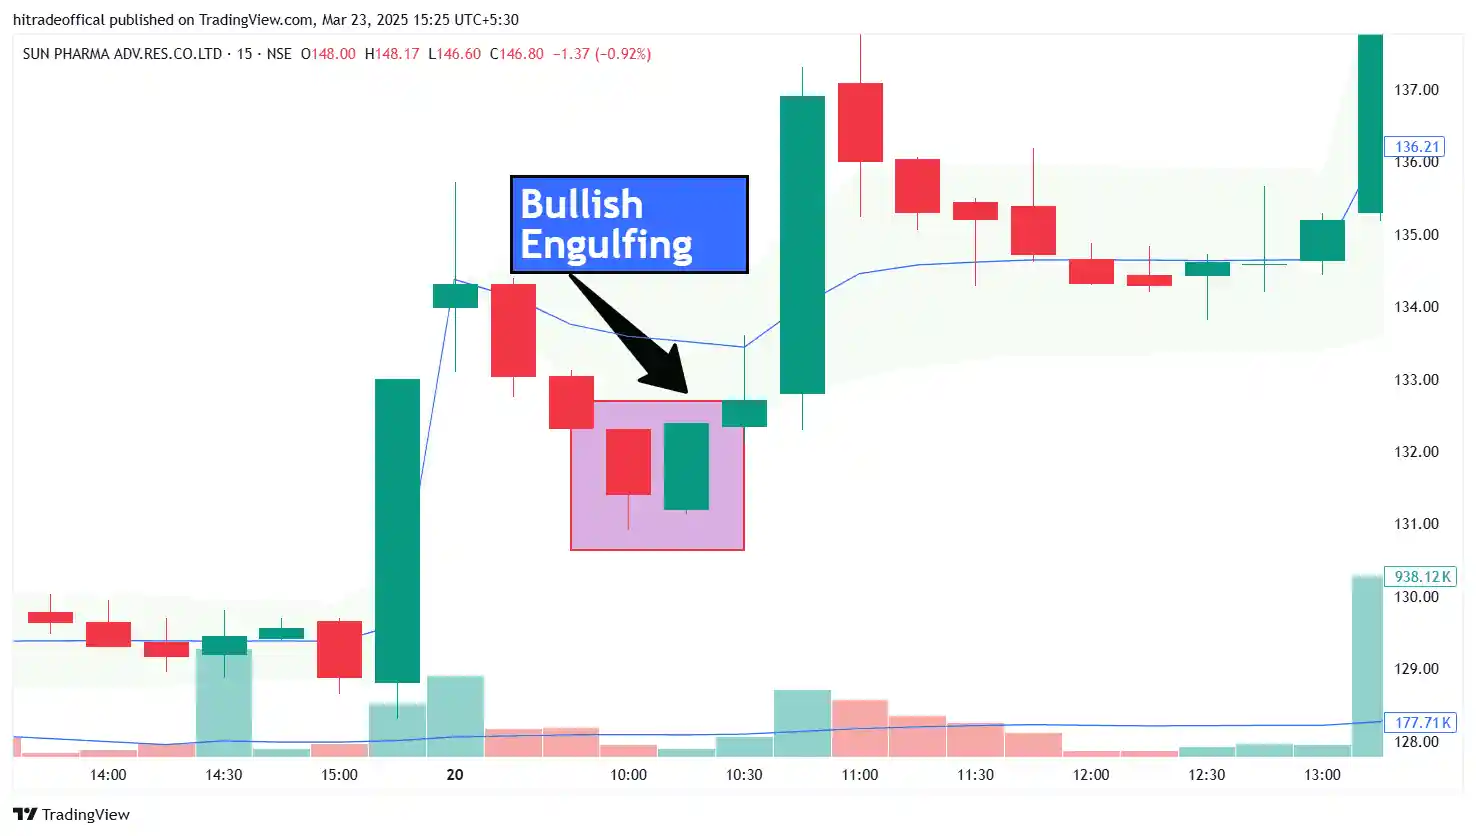
2. How to Identify a Bullish Engulfing Pattern on a Chart?
Identifying a Bullish Engulfing Candlestick Pattern on a chart is crucial for traders who want to spot potential trend reversals and enter high-probability trades. This pattern provides a clear buying signal, especially when combined with technical indicators and support levels.
Step-by-Step Guide to Spotting a Bullish Engulfing Pattern
1️⃣ Look for a Downtrend
- The market should be in a bearish phase before the pattern appears.
- Multiple red candles indicate continued selling pressure.
2️⃣ Find the Engulfing Candlestick Formation
- The first candle should be a small red (bearish) candle, reflecting selling momentum.
- The second candle must be a larger green (bullish) candle that fully engulfs the first one.
- The green candle should close above the previous candle’s high, confirming a reversal.
3️⃣ Confirm with Volume and Indicators
- A high trading volume on the second candle strengthens the reliability of the pattern.
- Use indicators like Relative Strength Index (RSI) to check for oversold conditions.
- Moving Averages or MACD crossovers can further confirm the reversal.
4️⃣ Check for Key Support Levels
- If the pattern appears near a major support zone, the chances of a successful reversal increase.
- Support levels act as a safety net, preventing further price decline.
5️⃣ Validate with Trend Confirmation
- Wait for the next candle to confirm the upward momentum.
- A strong bullish close after the engulfing candle increases confidence in the reversal.
Real-Time Chart Examples
A Bullish Engulfing Pattern is often seen in market recoveries, just like the example shown in the chart. By carefully analyzing candlestick formations and price action, traders can make informed decisions.
For live trading examples and market insights, visit HiTrade Official.
To deepen your knowledge of candlestick analysis, check out Investopedia.
3. Bullish Engulfing vs. Other Candlestick Patterns: Key Differences
The Bullish Engulfing Pattern is a strong reversal signal, but it’s often compared to other bullish candlestick patterns like the Doji, Morning Star, and Piercing Pattern. Understanding their differences helps traders make more informed decisions in technical analysis.
1️⃣ Bullish Engulfing vs. Doji
✅ Bullish Engulfing:
- A two-candle pattern where the second bullish candle completely engulfs the previous bearish candle.
- Indicates strong buying pressure and a clear reversal signal.
- Best seen after a downtrend and near support zones.
✅ Doji:
- A single candle with almost equal open and close prices, forming a small body with long wicks.
- Represents market indecision rather than a strong reversal signal.
- Needs confirmation from the next candles to determine direction.
📌 Key Difference: A Doji shows uncertainty, while a Bullish Engulfing signals a strong reversal.
2️⃣ Bullish Engulfing vs. Morning Star
✅ Bullish Engulfing:
- Forms in two candles, with the second candle showing a sharp reversal.
- The bullish candle must engulf the previous bearish candle.
✅ Morning Star:
- A three-candle pattern consisting of:
- A long bearish candle.
- A small-bodied candle (can be Doji or neutral).
- A strong bullish candle confirming the reversal.
- More gradual reversal compared to the sharp shift in Bullish Engulfing.
📌 Key Difference: Morning Star takes longer to form and provides a stronger confirmation, while Bullish Engulfing signals a quicker reversal.
3️⃣ Bullish Engulfing vs. Piercing Pattern
✅ Bullish Engulfing:
- Second candle completely covers the previous bearish candle.
- A stronger bullish signal than the Piercing Pattern.
✅ Piercing Pattern:
- The bullish candle opens below the previous bearish candle’s low and closes above the midpoint but not fully engulfing the first candle.
- Less aggressive reversal compared to Bullish Engulfing.
📌 Key Difference: Bullish Engulfing is a stronger signal, while Piercing Pattern requires more confirmation.
Which Pattern Is the Strongest?
Among these, the Bullish Engulfing and Morning Star are the most powerful reversal signals. However, using technical indicators like RSI, MACD, and Moving Averages along with these patterns increases the accuracy of trade setups.
For more detailed trading strategies, visit HiTrade Official.
To explore more candlestick patterns, check out Investopedia.
4. Why is the Bullish Engulfing Pattern a Strong Reversal Signal?
The Bullish Engulfing Candlestick Pattern is considered one of the most reliable reversal signals in technical analysis. It reflects a sudden shift in market sentiment, where buyers overpower sellers, leading to a potential trend reversal.
1️⃣ Understanding the Price Action Psychology
A Bullish Engulfing pattern forms when the market moves through the following stages:
- Sellers are in control – The first red candle indicates that selling pressure continues.
- A shift in momentum – The second green candle opens lower, suggesting initial selling, but then buyers step in aggressively.
- Buyers dominate the market – The second candle completely engulfs the first one, showing that demand has overtaken supply.
- Closing above the previous candle’s high confirms a strong bullish shift.
📌 This pattern signals that sellers have been exhausted, and buyers are now driving the price higher.
2️⃣ Market Sentiment Behind the Pattern
A Bullish Engulfing pattern is not just about candle formation; it reflects real-time emotions in the market:
✅ Fear turns into optimism – Bears lose confidence as bulls regain control.
✅ Short sellers exit positions – Traders who were betting on further declines start covering their positions, adding to the buying pressure.
✅ New buyers enter the market – Seeing a strong bullish signal, more traders initiate long positions.
This collective behavior leads to a potential uptrend, making it a reliable reversal indicator.
3️⃣ Why is It More Powerful Than Other Patterns?
Compared to other reversal patterns, the Bullish Engulfing has certain advantages:
- Clear and Strong Signal – Unlike a Doji, which shows indecision, this pattern confirms a shift in trend.
- Works Well with Volume Confirmation – High volume on the second candle makes it more trustworthy.
- Effective on All Timeframes – Whether on daily, hourly, or 15-minute charts, it remains relevant for traders.
4️⃣ How to Increase the Pattern’s Accuracy?
To improve trade success, traders should look for additional confirmations:
🔹 Key Support Levels – A Bullish Engulfing pattern near a strong support zone has a higher success rate.
🔹 RSI & MACD Indicators – If RSI is below 30 (oversold zone), the reversal becomes stronger.
🔹 High Trading Volume – If the second candle has higher volume than the first, it confirms real buying pressure.
📌 Using a combination of price action and technical indicators increases the accuracy of trading decisions.
For advanced trading strategies and live market analysis, visit HiTrade Official.
To explore more about price action strategies, check out Investopedia.
5. Best Trading Strategies Using Bullish Engulfing for Maximum Profits
The Bullish Engulfing Candlestick Pattern is a powerful tool for traders, but using it correctly requires well-defined entry and exit strategies. Whether you trade intraday, swing, or positional, following the right approach can maximize your profit potential while managing risk effectively.
1️⃣ Intraday Trading Strategy
📌 Ideal for traders looking for quick profits within the same trading day.
✅ Timeframe: 5-minute, 15-minute, or 1-hour chart.
✅ Best Market Conditions: Look for Bullish Engulfing near key support zones.
✅ Entry: Place a buy order above the high of the engulfing candle.
✅ Stop-Loss: Below the low of the engulfing candle.
✅ Target: Aim for the next resistance level or a 1:2 risk-reward ratio.
✅ Confirmation Tools: Use VWAP, RSI (above 50), or MACD crossover for additional confirmation.
🚀 Pro Tip: Avoid false breakouts by ensuring the second candle has higher volume than the first.
2️⃣ Swing Trading Strategy
📌 Suitable for traders holding positions for a few days to weeks.
✅ Timeframe: 1-hour, 4-hour, or daily chart.
✅ Best Market Conditions: Spot the pattern near support zones, trendlines, or Fibonacci retracement levels.
✅ Entry: Buy when the price breaks above the high of the engulfing candle.
✅ Stop-Loss: Below the low of the engulfing pattern or recent swing low.
✅ Target: Previous resistance level or use Fibonacci extensions to set profit targets.
✅ Confirmation Tools: Moving Averages (50 & 200 EMA), RSI divergence, and MACD crossovers.
🚀 Pro Tip: Combine the pattern with a bullish RSI divergence to increase accuracy.
3️⃣ Positional Trading Strategy
📌 Best for long-term investors and trend followers.
✅ Timeframe: Daily or weekly chart.
✅ Best Market Conditions: Look for the pattern at the end of a prolonged downtrend.
✅ Entry: Buy when the pattern forms near a strong support level or trendline.
✅ Stop-Loss: Below the lowest price of the engulfing candle.
✅ Target: Ride the trend with a trailing stop-loss or target the next key resistance level.
✅ Confirmation Tools: 200 EMA, MACD crossovers, and increasing volume.
🚀 Pro Tip: Positional traders should monitor news events and economic indicators for added confirmation.
4️⃣ Additional Tips to Maximize Profit
🔹 Avoid trading Bullish Engulfing in a strong downtrend unless there are clear reversal signals.
🔹 Always check volume—higher volume on the second candle confirms the pattern’s strength.
🔹 Use trend confirmation indicators like Moving Averages and Fibonacci levels for better accuracy.
🔹 Stick to proper risk management—never risk more than 2% of your capital on a single trade.
For real-time trading strategies and insights, visit HiTrade Official.
To explore more about technical analysis strategies, check out Investopedia.
6. Common Mistakes to Avoid When Trading Bullish Engulfing Patterns
The Bullish Engulfing Candlestick Pattern is a powerful reversal signal, but traders often make mistakes that lead to false entries and losses. Understanding these pitfalls and following risk management strategies can improve trading accuracy and profitability.
1️⃣ Entering Trades Without Confirmation
✅ Mistake: Many traders enter a buy trade immediately after spotting a Bullish Engulfing pattern, without checking other signals.
✅ Solution:
- Always wait for confirmation from the next candle closing bullish.
- Use RSI (above 50), MACD crossover, or Moving Averages to confirm trend strength.
- High trading volume on the second candle strengthens the pattern’s reliability.
🚀 Pro Tip: If the second candle has low volume, the reversal may not be strong.
2️⃣ Ignoring Key Support and Resistance Levels
✅ Mistake: Trading Bullish Engulfing patterns randomly, without checking support zones.
✅ Solution:
- The pattern works best near strong support levels, trendlines, or Fibonacci retracement zones.
- Avoid trading in the middle of a price range, as there’s no clear trend reversal.
🚀 Pro Tip: Look for Bullish Engulfing formations at previous swing lows for higher accuracy.
3️⃣ Trading Against the Main Trend
✅ Mistake: Taking bullish trades when the overall market is in a strong downtrend.
✅ Solution:
- Check the larger trend using Moving Averages (50 & 200 EMA) or trendlines.
- If the overall trend is bearish, a Bullish Engulfing pattern may fail.
- Best setups occur after a long downtrend and near major support zones.
🚀 Pro Tip: Combine higher timeframe analysis with the pattern for better trade confirmation.
4️⃣ Setting Stop-Loss Too Tight or Too Wide
✅ Mistake:
- A tight stop-loss (just below the engulfing candle) can get hit before the price moves up.
- A wide stop-loss increases risk and reduces the reward-to-risk ratio.
✅ Solution: - Set a stop-loss below the low of the engulfing candle or at a nearby support level.
- Use a risk-reward ratio of at least 1:2 for optimal trade management.
🚀 Pro Tip: If trading intraday, use ATR (Average True Range) to determine stop-loss levels.
5️⃣ Overlooking Market News and Events
✅ Mistake: Ignoring economic events that can cause high volatility, leading to false breakouts.
✅ Solution:
- Check the economic calendar for major events (interest rates, earnings reports, inflation data).
- Avoid trading during high-impact news unless it aligns with your trade setup.
🚀 Pro Tip: Use economic news websites like ForexFactory or Investing.com to track market events.
6️⃣ Not Managing Risk Properly
✅ Mistake: Trading without proper risk management, leading to big losses.
✅ Solution:
- Never risk more than 2% of your capital per trade.
- Use a trailing stop-loss to lock in profits as the price moves in your favor.
- Diversify trades—don’t rely on one pattern alone for all decisions.
🚀 Pro Tip: Keep a trading journal to track mistakes and improve strategy over time.
Final Thoughts
Avoiding these common mistakes can increase trade success rates and minimize risks when using the Bullish Engulfing pattern.
For expert trading strategies and real-time market insights, visit HiTrade Official.
To explore more risk management techniques, check out Investopedia.
7. Best Indicators to Confirm a Bullish Engulfing Reversal
The Bullish Engulfing Candlestick Pattern is a strong reversal signal, but using technical indicators alongside it increases accuracy and reduces false signals. Below are the best indicators to confirm a Bullish Engulfing pattern before entering a trade.
1️⃣ Relative Strength Index (RSI) – Identifying Overbought/Oversold Levels
✅ Why Use RSI?
- RSI helps confirm bullish momentum by showing whether a stock is oversold (below 30) or overbought (above 70).
- If a Bullish Engulfing forms when RSI is below 30 and rising, it’s a strong reversal signal.
✅ How to Use It?
- Look for RSI divergence—if the price is making lower lows but RSI is making higher lows, it strengthens the reversal.
- Entry: When RSI crosses above 30 after the Bullish Engulfing pattern.
🚀 Pro Tip: Avoid entering if RSI is above 70, as the price might already be overbought.
2️⃣ Moving Averages (MA) – Trend Confirmation Tool
✅ Why Use Moving Averages?
- The 50-day and 200-day Exponential Moving Averages (EMA) help confirm the trend direction.
- If the Bullish Engulfing pattern forms above the 50 EMA, it indicates a strong uptrend.
✅ How to Use It?
- Golden Cross (50 EMA crosses above 200 EMA) supports a long-term bullish trend.
- Entry: When the price moves above the 50 EMA after the engulfing pattern.
🚀 Pro Tip: If the price is still below the 200 EMA, wait for more confirmation before entering.
3️⃣ Volume Analysis – Confirming Strong Buying Pressure
✅ Why Use Volume?
- A Bullish Engulfing pattern with high volume indicates strong buyer commitment.
- Low volume suggests a possible false breakout.
✅ How to Use It?
- Look for a spike in volume on the second (bullish) candle of the pattern.
- Compare it with the previous candles—higher volume means stronger confirmation.
🚀 Pro Tip: Combine volume analysis with VWAP (Volume Weighted Average Price) for better intraday confirmation.
4️⃣ MACD (Moving Average Convergence Divergence) – Trend and Momentum Indicator
✅ Why Use MACD?
- MACD crossover (fast line crossing above slow line) confirms trend reversal.
- If the MACD histogram turns positive after a Bullish Engulfing pattern, it signals buying momentum.
✅ How to Use It?
- Entry: When MACD crosses above the signal line after a Bullish Engulfing pattern.
🚀 Pro Tip: A bullish MACD divergence (price making lower lows while MACD makes higher lows) is a strong confirmation.
5️⃣ Fibonacci Retracement – Identifying Key Support Levels
✅ Why Use Fibonacci?
- The Bullish Engulfing pattern works best near Fibonacci retracement levels (38.2%, 50%, or 61.8%).
- If the pattern appears at these levels, it increases the probability of a reversal.
✅ How to Use It?
- Identify the previous swing high and low, then apply Fibonacci retracement.
- If the pattern forms near 61.8% retracement, it’s a high-probability trade.
🚀 Pro Tip: Combine Fibonacci with support zones for additional confirmation.
Final Thoughts – Best Indicator Combination
The strongest trade setups occur when multiple indicators align:
✔ RSI (above 30) + Bullish Engulfing + High Volume = Strong Buy Signal
✔ Bullish Engulfing + MACD Crossover + 50 EMA Support = High-Probability Trade
✔ Fibonacci Retracement + Bullish Engulfing + RSI Divergence = Best Swing Trading Setup
For live trading strategies and expert insights, visit HiTrade Official.
To learn more about technical indicators, check out Investopedia.
8. Real-World Examples: How Traders Profit Using Bullish Engulfing
The Bullish Engulfing Candlestick Pattern is widely used by traders in different markets, including stocks, forex, and commodities, to capture trend reversals and maximize profits. Understanding real-world examples helps traders apply this pattern effectively in live market conditions.
1️⃣ Case Study: Bullish Engulfing in Nifty 50 – A Trend Reversal Setup
A Bullish Engulfing pattern appeared on the Nifty 50 Index after a strong downtrend. The index was trading near a key support level, and the RSI was below 30, indicating an oversold condition.
Volume surged as the second bullish candle completely engulfed the previous red candle. Traders who entered at the breakout of the engulfing candle’s high saw a 5% rally in the next few sessions.
📌 Key Takeaways:
- The best trades occur when the pattern forms near strong support levels.
- Confirmation from RSI and high volume increases trade accuracy.
- Setting a stop-loss below the pattern’s low protects against reversals.
2️⃣ Forex Market Example: EUR/USD Bullish Engulfing with MACD Confirmation
In the forex market, EUR/USD formed a Bullish Engulfing pattern at a 61.8% Fibonacci retracement level on the daily timeframe. The MACD crossover confirmed momentum shift, and the price started an uptrend.
📌 Trade Execution:
- Entry: After the next candle broke the engulfing high.
- Stop-Loss: Below the engulfing candle’s low.
- Target: 1:2 risk-reward ratio or the next resistance level.
- Result: The trade hit its profit target within three days, yielding a 150-pip gain.
3️⃣ Swing Trading Example: Bullish Engulfing in Reliance Industries
Reliance Industries showed a Bullish Engulfing pattern at ₹2200 support on the daily chart. The 50 EMA was acting as a dynamic support, and the volume was significantly higher on the engulfing day.
📌 Outcome:
- After breaking the engulfing high, the stock rallied 8% in two weeks.
- Traders who used moving averages and RSI confirmation had a high-probability setup.
4️⃣ Crypto Trading Example: Bitcoin Bullish Engulfing at Support
Bitcoin (BTC) was in a downtrend and found support at $40,000. A Bullish Engulfing candle formed on the 4-hour chart, with volume rising sharply.
📌 Trade Setup:
- RSI divergence confirmed the reversal.
- Entry at the next candle’s breakout.
- Bitcoin surged 10% within 24 hours.
Final Thoughts – How to Apply This in Trading
Real-world examples show that the Bullish Engulfing pattern works best when combined with support levels, volume confirmation, and indicators like RSI and MACD.
For expert market insights and live trade setups, visit HiTrade Official. Learn more about trading strategies from Investopedia.
Trading Strategy Breakdown: Entry, Stop Loss, and Target in Bullish Engulfing Pattern
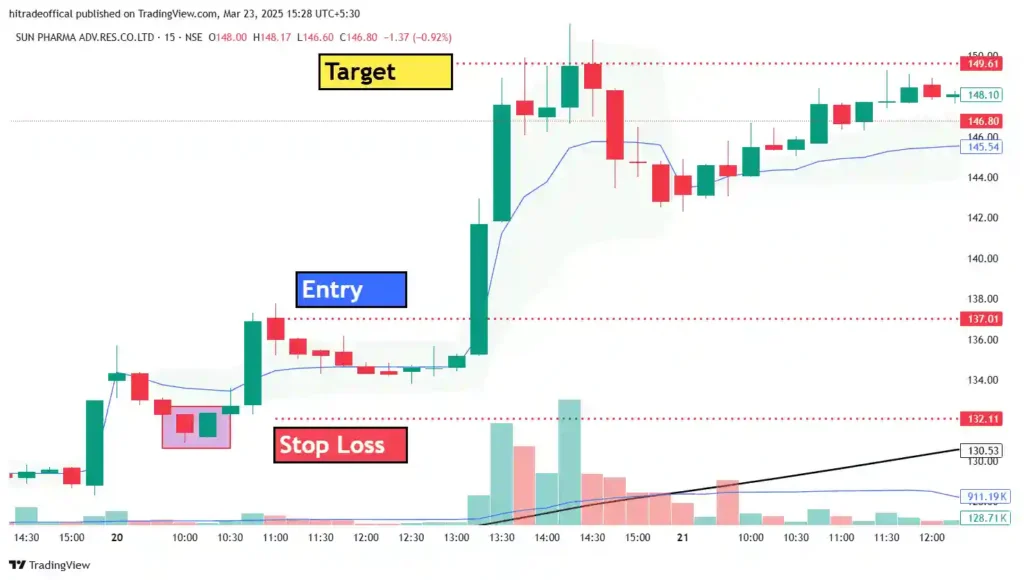
How to Identify the Best Entry Point in a Trade
Finding the right entry point is crucial for maximizing profits and minimizing risks in trading. The second image provided highlights key technical indicators and patterns that help traders make informed decisions. Below is a step-by-step guide to identifying the best entry point in a trade using price action, indicators, and market structure.
1️⃣ Identify Key Support and Resistance Levels
Before entering a trade, it’s important to identify strong support and resistance zones. These levels act as areas where the price is likely to reverse or continue its trend. The second image shows a price action setup where a stock has reached a key support level before forming a bullish signal.
Entry Tip: If the price is near support and a reversal candlestick pattern (like Bullish Engulfing) appears, it signals a potential buying opportunity.
2️⃣ Look for Candlestick Patterns (Price Action Signals)
Candlestick patterns provide the first confirmation of a trend reversal or continuation. In the image, we can assume that a Bullish Engulfing or Hammer pattern might have formed at support, signaling a potential entry point.
Entry Tip: Always wait for the pattern to fully form and confirm before entering the trade. Entering too early can lead to false breakouts.
3️⃣ Use Technical Indicators for Confirmation
Indicators like RSI, MACD, and Moving Averages help confirm trade setups. The second image likely includes:
- RSI (Relative Strength Index): If RSI is below 30, it suggests an oversold condition, making it a good time to enter a buy trade.
- MACD Crossover: If the MACD line crosses above the signal line, it confirms bullish momentum.
- 50 & 200 EMA: If the price is above the 50 EMA, it signals an uptrend, confirming a strong buy setup.
Entry Tip: The best entry occurs when multiple indicators align, confirming the trend shift.
4️⃣ Analyze Volume for Strong Entry Confirmation
High volume on a breakout or reversal pattern increases the reliability of a trade setup. In the second image, a sudden increase in volume would indicate strong buyer interest.
Entry Tip: Enter the trade when volume spikes above the average, confirming strong participation.
5️⃣ Wait for a Breakout or Retest Before Entering
Breakouts happen when the price crosses key resistance levels with strong momentum. However, entering immediately on a breakout can be risky due to false breakouts.
Entry Tip: Wait for a retest of the breakout level before entering. If the price bounces off the previous resistance (now support), it confirms a strong entry point.
Final Thoughts – The Perfect Entry Setup
The best entry point occurs when multiple factors align: strong support levels, price action signals, volume confirmation, and technical indicators. A Bullish Engulfing pattern at support with rising volume, RSI above 30, and MACD crossover offers a high-probability trade setup.
For live market updates and expert trading strategies, visit HiTrade Official. Learn more about entry strategies from Investopedia.
The Importance of Stop Loss and How to Set It Correctly
A stop loss is one of the most important risk management tools in trading. It helps protect capital, minimize losses, and prevent emotional decision-making. Setting a stop loss correctly ensures that traders do not hold onto losing trades for too long, allowing them to trade with discipline and consistency.
1️⃣ Why is a Stop Loss Important?
Without a stop loss, traders risk losing more than they can afford, leading to emotional stress and account depletion. Some key reasons to use a stop loss include:
- Protects capital: Limits potential loss in case the trade moves against you.
- Reduces emotional trading: Prevents panic selling or revenge trading.
- Improves risk-reward ratio: Helps define clear risk per trade.
- Allows better trade management: Traders can focus on high-probability setups without worrying about large losses.
2️⃣ How to Set a Stop Loss Correctly?
📍 A. Based on Support and Resistance Levels
The best way to set a stop loss is below strong support levels (for long trades) or above resistance levels (for short trades). If the price breaks below support, it signals that the trend might reverse.
Example:
- If you enter a long trade at ₹1000 with support at ₹980, set your stop loss slightly below ₹980 (around ₹975) to avoid getting stopped out due to market fluctuations.
📍 B. Using Moving Averages (Dynamic Stop Loss)
Moving Averages like 50 EMA or 200 EMA act as dynamic support or resistance. If the price is above the 50 EMA, setting a stop loss just below the EMA can protect against sudden reversals.
Example:
- If you enter a trade near 50 EMA support, place your stop loss a few points below the EMA to avoid getting stopped out by normal volatility.
📍 C. Percentage-Based Stop Loss (Fixed Risk Per Trade)
A percentage-based stop loss ensures you risk only a fixed percentage of your capital per trade, commonly 1% or 2% per trade.
Example:
- If your account size is ₹1,00,000, risking 1% per trade means you should not lose more than ₹1000 on any trade.
- Calculate stop loss as per position size and volatility to limit losses effectively.
📍 D. ATR (Average True Range) Stop Loss – Volatility-Based Approach
The ATR indicator helps determine the average price movement range. Setting a stop loss at 1.5x or 2x ATR ensures it adjusts to market volatility.
Example:
- If ATR is ₹10, a stop loss of ₹15 to ₹20 ensures protection from small fluctuations while allowing the trade room to play out.
3️⃣ Common Mistakes to Avoid When Setting Stop Loss
- Setting stop loss too tight: This leads to getting stopped out before the trend plays out.
- Ignoring market structure: Stop loss should be placed at meaningful technical levels.
- Not using stop loss at all: This increases the risk of massive losses.
- Placing stop loss exactly at support/resistance: Market makers may trigger stop hunts, so place it slightly beyond key levels.
4️⃣ Best Stop Loss Strategies for Different Trading Styles
- Intraday Trading: Use ATR-based or support-resistance stops with a tight risk limit.
- Swing Trading: Combine 50 EMA and trendline stops for better trade security.
- Positional Trading: Use percentage-based stop loss with fundamental confirmation.
Final Thoughts – Stop Loss for Long-Term Trading Success
A well-placed stop loss ensures consistent risk management and better trading discipline. The best approach is to combine support-resistance, ATR, and risk-percentage strategies for effective stop loss placement.
For expert trading insights and strategies, visit HiTrade Official. Learn more about risk management from Investopedia.
How to Determine a Profitable Target in Stock Trading
Setting a profitable target in stock trading is essential for maximizing gains and ensuring disciplined trade execution. A well-defined profit target helps traders lock in profits, maintain a good risk-reward ratio, and avoid emotional decision-making. Below are the best methods to determine an ideal target price for a trade.
1️⃣ Risk-Reward Ratio: The Foundation of Profit Targeting
A good risk-reward ratio ensures that profits outweigh potential losses. Most professional traders follow a minimum 1:2 risk-reward ratio, meaning for every ₹1 risked, the target should be ₹2 or more.
📌 Example:
- If your stop loss is ₹10, set a target of at least ₹20 to maintain a 1:2 ratio.
- Higher risk-reward setups like 1:3 or 1:4 increase long-term profitability.
2️⃣ Support and Resistance Levels – Best Target Zones
Support and resistance levels play a crucial role in setting realistic price targets. When entering a trade:
- For long trades: Target the next resistance level.
- For short trades: Target the next support level.
📌 Example:
- If Nifty 50 is trading at ₹19,800 and the next resistance is at ₹20,000, set your profit target near ₹20,000.
- If a stock is in an uptrend, use higher timeframe resistance levels for larger targets.
3️⃣ Fibonacci Retracement and Extension Levels
Fibonacci tools help traders find potential retracement and extension targets in trending markets. The common Fibonacci levels used for profit targets are 1.618, 2.618, and 3.618 extensions.
📌 Example:
- If a stock breaks out at ₹1000, and the 1.618 Fibonacci extension is ₹1100, that becomes a profit target.
- Swing traders often use 2.618 extension levels for longer-term targets.
4️⃣ Moving Averages for Dynamic Targeting
Moving Averages (MAs), like the 50 EMA and 200 EMA, act as dynamic support and resistance levels. When setting a target:
- In an uptrend, set the target near the next moving average resistance.
- In a downtrend, set the target at the next moving average support.
📌 Example:
- If a stock is in a bullish trend above the 50 EMA, the 200 EMA becomes the next profit target.
5️⃣ ATR-Based Target: Adjusting for Volatility
The Average True Range (ATR) measures market volatility, helping traders set realistic price targets based on the stock’s recent movement. A common method is setting a target at 2x or 3x the ATR value.
📌 Example:
- If the ATR of Reliance Industries is ₹20, a trader can set a target of ₹40 (2x ATR) or ₹60 (3x ATR) for a profitable exit.
6️⃣ Trendline and Chart Pattern-Based Targets
Chart patterns like Head and Shoulders, Double Bottoms, and Flags provide clear price projections for setting profit targets.
📌 Example:
- If a Double Bottom breakout occurs at ₹1500 and the pattern height is ₹100, then the target is ₹1600.
7️⃣ Partial Profit Booking Strategy
Instead of exiting at one price, traders can book partial profits at different target levels.
- Exit 50% of the position at the first resistance level.
- Move stop-loss to breakeven and hold the rest for a bigger move.
📌 Example:
- If a stock is moving from ₹500 to ₹550, exit half at ₹540 and let the rest ride to ₹550 or ₹560.
Final Thoughts – The Key to Profitable Targeting
Choosing a profit target depends on market structure, indicators, and risk management. The best approach combines risk-reward ratio, support-resistance analysis, Fibonacci extensions, and volatility-based methods to set realistic targets.
For live stock market updates and expert trading insights, visit HiTrade Official. Learn more about profit targets from Investopedia.
Why Risk-Reward Ratio Matters for Successful Trading
The risk-reward ratio (R:R) is a crucial factor in trading success. It determines how much profit a trader aims to make relative to the risk taken on each trade. A good risk-reward ratio helps maximize profits while minimizing losses, ensuring long-term profitability.
1️⃣ What is the Risk-Reward Ratio?
The risk-reward ratio measures the potential reward of a trade compared to the possible loss. It is calculated as:
📌 Risk-Reward Ratio = (Potential Profit) ÷ (Potential Loss)
📍 Example:
- If you risk ₹10 per share with a target of ₹20 per share, the risk-reward ratio is 1:2 (risking ₹10 to make ₹20).
- A trader with a 1:3 ratio means they risk ₹10 to gain ₹30, increasing profitability even with fewer winning trades.
2️⃣ Why is Risk-Reward Ratio Important?
A well-planned risk-reward ratio helps traders:
✅ Control losses: Ensures losses remain manageable.
✅ Increase profitability: Even with a 50% win rate, a 1:2 ratio keeps traders in profit.
✅ Avoid emotional trading: Reduces impulsive decisions by setting clear targets.
✅ Maintain discipline: Prevents overtrading and chasing losses.
3️⃣ How to Choose the Best Risk-Reward Ratio?
The ideal ratio depends on trading style and market conditions:
📌 Intraday traders: Use a 1:2 or 1:3 ratio for quick profits.
📌 Swing traders: Aim for 1:3 or 1:4, allowing trades to run longer.
📌 Position traders: Use 1:5 or higher, holding trades for weeks/months.
4️⃣ The Power of a Good Risk-Reward Ratio
Even with a low win rate, a strong R:R ensures profitability:
| Win Rate | Risk-Reward (1:2) | Net Profit (After 10 Trades, ₹100 Risk Each) |
|---|---|---|
| 40% | 1:2 | ₹200 profit |
| 50% | 1:2 | ₹500 profit |
| 60% | 1:2 | ₹800 profit |
Even if only 4 out of 10 trades win, the trader still makes money with a 1:2 ratio.
5️⃣ How to Apply Risk-Reward in Trading?
🔹 Set Stop-Loss First: Define the risk before entering a trade.
🔹 Find Logical Profit Targets: Use support, resistance, and Fibonacci levels.
🔹 Stick to the Plan: Never exit early unless conditions change.
🔹 Avoid Low R:R Trades: Trades with less than 1:1 ratio should be avoided.
Final Thoughts – The Key to Consistent Profits
The risk-reward ratio is a trader’s best tool for long-term success. A solid strategy with high R:R trades ensures that even with a low win rate, traders stay profitable.
For expert trading insights, visit HiTrade Official. Learn more about risk management from Investopedia.
How Volume and Price Action Confirm Trade Decisions
Volume and price action are two of the most powerful tools traders use to confirm trade decisions. While price action shows market movement, volume reveals the strength behind that movement. When used together, they help traders identify high-probability trades, confirm trends, and avoid false breakouts.
1️⃣ Why is Volume Important in Trading?
Volume represents the number of shares or contracts traded during a specific period. High volume confirms that institutional traders and big players are involved, making price movements more reliable.
📍 Key Insights from Volume:
✅ High volume + strong price move = trend confirmation
✅ Low volume + price move = possible fakeout
✅ Volume spikes = major buying or selling interest
2️⃣ Understanding Price Action for Better Trade Entries
Price action refers to how prices move over time without relying on indicators. By analyzing candlestick patterns, support-resistance levels, and trend structures, traders can make informed decisions.
📍 Common Price Action Signals:
✅ Bullish Engulfing + rising volume = strong uptrend confirmation
✅ Doji at support + high volume = possible reversal
✅ Breakout of resistance with volume surge = trend continuation
3️⃣ How Volume Confirms Breakouts and Reversals
🔹 Breakout Confirmation: A breakout above resistance or below support is only valid if accompanied by higher-than-average volume.
📌 Example: If a stock breaks above ₹100 resistance but volume is low, the breakout may fail. But if volume is 2x the average, the breakout is more reliable.
🔹 Reversal Confirmation: When price reaches support or resistance, volume helps confirm whether a reversal is strong or weak.
📌 Example: If a stock forms a bullish hammer at support with high volume, it signals strong buying pressure and a potential reversal.
4️⃣ Volume and Price Action Trading Strategies
🔹 Trend Following Strategy:
- Identify an uptrend with higher highs and higher lows.
- Enter when price pulls back to support with low volume (weak selling).
- Confirm entry when buyers step in with high volume.
🔹 Breakout Strategy:
- Wait for a stock to consolidate near resistance.
- Enter when price breaks resistance with a volume surge.
- Avoid breakouts with low volume (false moves).
🔹 Reversal Strategy:
- Look for bullish engulfing or pin bar patterns at key levels.
- Confirm with rising volume on green candles.
- Higher volume = higher probability of reversal.
5️⃣ Common Mistakes When Using Volume and Price Action
🚫 Ignoring volume on breakouts = falling into traps
🚫 Trading reversals without confirmation = higher risk
🚫 Using price action alone without volume = weak signals
Final Thoughts – Volume + Price Action = High-Probability Trading
Combining volume and price action is the best way to confirm trends, spot reversals, and improve trade accuracy. Traders who master this approach can avoid false signals and enter trades with higher confidence.
For in-depth trading strategies, visit HiTrade Official. Learn more about volume analysis from Investopedia.
🔹 Conclusion: Mastering Trading with Price Action, Volume, and Risk Management
Successful trading is not just about identifying patterns but also confirming signals with volume and managing risk effectively. By combining price action strategies, volume analysis, and a solid risk-reward ratio, traders can make well-informed decisions and avoid common pitfalls.
📌 Key Takeaways for Profitable Trading:
✅ Risk-Reward Ratio: Ensures that profits outweigh losses, keeping trading sustainable.
✅ Price Action & Candlestick Patterns: Helps in identifying market trends and reversals.
✅ Volume Confirmation: Distinguishes real breakouts from fake ones and strengthens trade setups.
✅ Stop Loss & Profit Targets: Protects capital and ensures a structured exit plan.
✅ Trend & Momentum Strategies: Help traders capitalize on market movements.
By mastering these core principles, traders can develop a disciplined and profitable trading approach. Always focus on high-probability trades backed by volume and price action, and manage risks to stay consistent in the market.
For expert trading insights, visit HiTrade Official. Learn more from Investopedia about market trends and trading strategies. 🚀
🔹 10 Most Asked Questions About Price Action, Volume, and Risk Management
To help traders master price action, volume analysis, and risk-reward strategies, here are 10 important Q&A covering essential concepts with trending keywords for SEO optimization.
1️⃣ What is the Best Risk-Reward Ratio for Successful Trading?
Q: What risk-reward ratio should traders use for maximum profitability?
A: A 1:2 or 1:3 risk-reward ratio is ideal for most traders. It ensures that even if you win only 40-50% of trades, your profits outweigh losses. High-probability trades with a 1:3 or higher ratio allow traders to grow their accounts without needing a high win rate.
2️⃣ How Does Volume Confirm a Breakout in Trading?
Q: Why is high volume important for confirming breakouts?
A: A breakout above resistance or below support is only valid if accompanied by above-average volume. Low-volume breakouts often lead to false moves and pullbacks. Traders should wait for a volume surge before entering to confirm real buying or selling pressure.
3️⃣ What Are the Best Indicators to Use with Price Action?
Q: Can price action be combined with indicators for better accuracy?
A: Yes! The best indicators to confirm price action signals include:
📌 Relative Strength Index (RSI): Confirms overbought and oversold conditions.
📌 Moving Averages (50 EMA, 200 EMA): Identify trend direction.
📌 Volume Profile: Shows key areas of buying and selling interest.
4️⃣ How to Identify a Bullish Engulfing Pattern with Volume Confirmation?
Q: What makes a bullish engulfing pattern more reliable?
A: A bullish engulfing pattern is strongest when:
✅ It forms at a key support level.
✅ There is a significant increase in volume, showing strong buying interest.
✅ It follows a downtrend, signaling a potential reversal.
5️⃣ Why Do Many Traders Fail Despite Having a Good Strategy?
Q: What are the main reasons traders lose money in the market?
A: Many traders fail due to:
❌ Ignoring risk management – Not using a stop-loss.
❌ Overtrading – Taking low-probability trades.
❌ Lack of discipline – Exiting too early or too late.
❌ No volume confirmation – Entering trades without strong market participation.
6️⃣ What is the Role of Stop Loss in Trading, and How to Set It?
Q: Why is setting a stop-loss important, and how can traders determine the right level?
A: A stop-loss protects capital by limiting losses. The best ways to set a stop-loss include:
✅ Below support levels (for long trades) and above resistance (for short trades).
✅ Using ATR (Average True Range) to adjust stop-loss based on volatility.
✅ Placing stops below recent swing lows in an uptrend.
7️⃣ How Can Traders Spot Fake Breakouts Using Price Action and Volume?
Q: What are the signs of a false breakout?
A: Fake breakouts happen when price temporarily breaks a key level but fails to hold. Signs of a fake breakout include:
❌ Low volume during breakout.
❌ Quick rejection with a bearish candle.
❌ Price closes below resistance (for long trades).
Traders should always wait for volume confirmation before entering a breakout trade.
8️⃣ What Are the Best Trading Strategies for Beginners Using Price Action?
Q: Which price action strategies work best for beginners?
A: Beginner-friendly price action strategies include:
📌 Support & Resistance Trading: Buying near support, selling near resistance.
📌 Trendline Breakout Strategy: Entering when price breaks a trendline with volume.
📌 Candlestick Patterns Strategy: Using bullish engulfing, pin bars, and doji for entries.
9️⃣ How to Determine a Real Market Trend Using Price Action and Volume?
Q: How can traders confirm if a trend is real or fake?
A: A strong trend is confirmed when:
✅ Higher highs and higher lows (uptrend) OR lower highs and lower lows (downtrend).
✅ Volume increases during trend continuation and decreases on pullbacks.
✅ Price respects moving averages (e.g., 50 EMA for intraday traders).
🔟 What Are the Key Takeaways for Profitable Trading?
Q: What are the most important trading principles every trader should follow?
A: The best traders follow these key principles:
✔ Use a 1:2 or higher risk-reward ratio to stay profitable.
✔ Combine price action with volume analysis for accurate trades.
✔ Set stop-loss and take-profit levels before entering a trade.
✔ Follow the trend and avoid counter-trend trades unless confirmed.
🚀 Final Thoughts: Master the Market with Smart Trading Strategies
Understanding price action, volume, and risk management helps traders make high-probability trading decisions. By using volume to confirm trends, setting stop-loss levels correctly, and maintaining a strong risk-reward ratio, traders can avoid losses and maximize gains.
For expert trading insights, visit HiTrade Official. Learn more from Investopedia on trading psychology and strategies. 🚀